Label Applicators
Label Applicators Market Size, Share & Growth Report | 2034
Label Applicators Market Size, Share, Growth, and Industry Analysis: By Type (Automatic Label Applicators, Semi-Automatic Label Applicators, Manual Label Applicators); By Application (Food & Beverage, Pharmaceuticals, Consumer Goods); Regional Insights and Forecast to 2034
1. Market Overview
Label applicators are critical mechanical systems designed to dispense and apply pressure-sensitive, shrink sleeve, or glue-applied labels onto containers, packaging boxes, and individual products. As modern manufacturing transitions to high-speed output and automated configurations (Industry 4.0), the reliance on modern labeling systems has scaled aggressively. These systems ensure accurate branding, barcoding, ingredient printing, and critical regulatory tracing information are flawlessly applied across various physical form factors.
2. Key Market Highlights
- Automation Overdrive: High-speed production lines are aggressively replacing manual and semi-automatic units with fully integrated, automated systems to reduce human error and operational bottlenecks.
- Traceability & Compliance: Rising governmental mandates for serialization in pharmaceuticals and detailed nutritional transparency in food and beverage are establishing labeling equipment as an indispensable component of packaging lines.
- Eco-Design Focus: Modern applicators are shifting toward machinery capable of handling ultra-thin, biodegradable, or paper-based liners to align with global corporate sustainability goals.
3. Market Forecast & Data Table
| Market Metric | Value / Detail |
|---|---|
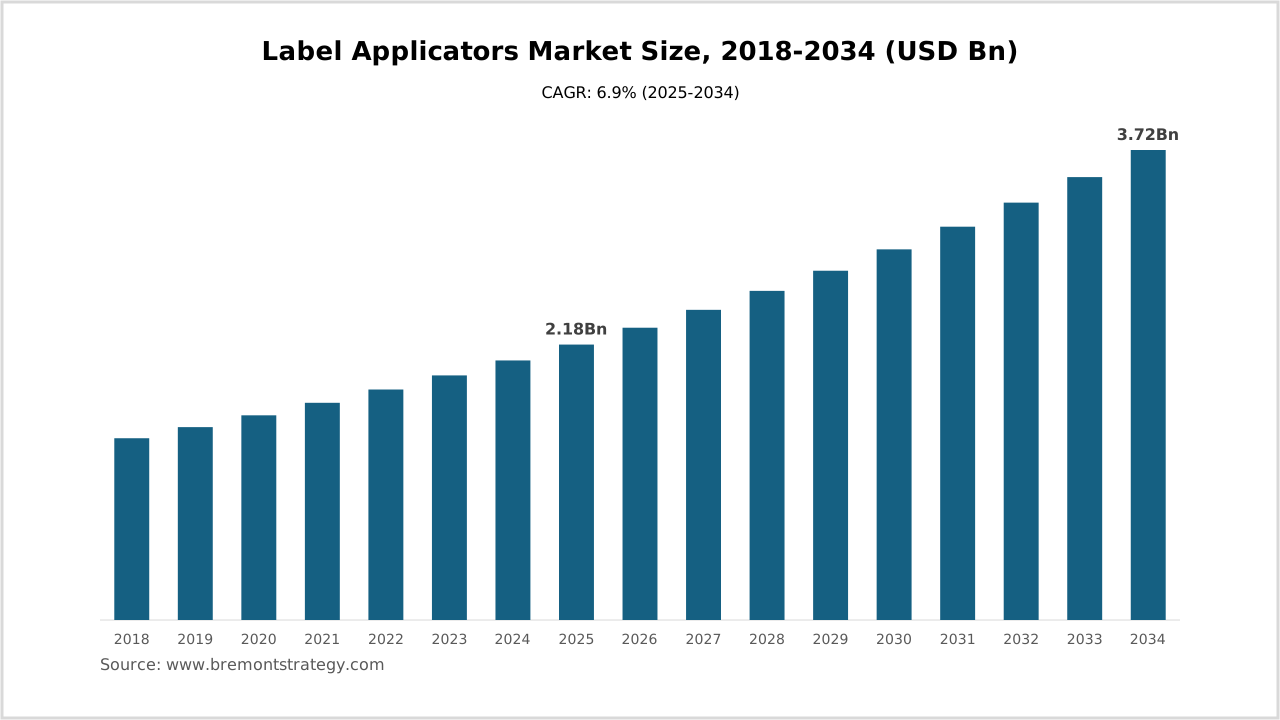
| Market Size (2026 Base Year) | USD 2.18 Billion |
| Projected Market Size (2034 Target Year) | USD 3.72 Billion |
| Forecast Period | 2026 – 2034 |
| Compound Annual Growth Rate (CAGR) | 6.9% |
| Dominant Region | North America (led by massive food, pharma, and e-commerce distribution networks) |
4. Segmentation Analysis
A. By Type
- Automatic Label Applicators: Holds the largest revenue share. Primarily integrated directly into conveyor lines for uninterrupted, high-throughput manufacturing.
- Semi-Automatic Label Applicators: Favored by small-to-medium enterprises (SMEs) and boutique packagers who need flexibility for multiple SKU sizes without massive capital investment.
- Manual Label Applicators: Handheld or tabletop units deployed in low-volume specialty shops, warehouses for corrective relabeling, and artisanal production lines.
B. By Application
- Food & Beverage: The largest application sector. Driven by packaging aesthetic requirements, regional nutrition labeling compliance, and massive daily throughput demands.
- Pharmaceuticals: The fastest-growing sector, dominated by strict safety standards, track-and-trace legislation, and the necessity for zero-tolerance labeling accuracy on vials, syringes, and cartons.
- Consumer Goods: Fueled by home care, personal hygiene, and cosmetics where product aesthetics, tactile sleeve experiences, and shape-conforming labels drive consumer buying behavior.
5. DROC Analysis (Drivers, Restraints, Opportunities, Challenges)
E-commerce & Logistics Expansion: Seamless shipping demands highly accurate, dynamically generated labeling at transit hubs.
Regulatory Compliance: Strict FDA, EU, and global standards dictate rigorous labeling guidelines, driving quick equipment upgrades.
High Initial Capital Investment: Sophisticated automatic applicators, combined with conveying and inspection systems, require substantial upfront CapEx, pushing SMEs toward semi-automated or manual fallbacks.
Industry 4.0 Integration: Developing IoT-enabled smart applicators with remote diagnostics, predictive maintenance sensors, and automated setup changes.
Growth in Emerging Markets: Expanding food and beverage processing hubs across the APAC and Latin American territories.
Eco-Material Handling: Developing reliable dispensing nozzles and feed systems for thin, eco-friendly, or bio-degradable backing materials without tearing or causing operational downtime.
6. Market Share & Regional Insights
North America is expected to retain the leading market share through 2034 due to early adoption of automated packaging systems, high concentration of dominant pharma and consumer goods companies, and robust regional logistics networks.
Meanwhile, the Asia-Pacific region is projected to register the fastest growth rate. This rapid pace is fueled by expanding domestic manufacturing sectors, rising disposable incomes driving demand for packaged food, and government initiatives aimed at upgrading industrial packaging infrastructure.
TABLE OF CONTENTS
1. Research Methodology
2. Market Structure
3. Executive Summary
4. Label Applicators Market Overview
- 4.1 Introduction
- Market Snapshot
- Assumptions, Inclusion & Exclusions
- Technological Advancements & Patent Analysis
- Case Studies
- Market Entry & Launch Strategies
- Macro-Economic Factors Impacting the Market Growth
- 4.2 Label Applicators Market Dynamics
- Market Drivers
- Market Restraints
- Market Opportunity
- 4.3 Label Applicators Market - Supply Chain Analysis
- Key Raw Material/Components Provider
- Key Manufacturers
- Key Distributors
- Key Consumers
- 4.4 Key Forces Shaping the Label Applicators Market
- Bargaining Power of Suppliers
- Bargaining Power of Buyers
- Threat of Substitution
- Threat of New Entrants
- Competitive Rivalry
- 4.1 Introduction
5. Global Label Applicators Market, By Type
- 5.1 Market Size, Value (USD Mn) & Volume (Units)
- Automatic Label Applicators
- Semi-Automatic Label Applicators
- Manual Label Applicators
- 5.2 Key Market Trends & Growth Opportunities
- 5.3 Market Share (%) Analysis, 2018-2034
- 5.4 Year-on-Year (YoY) Growth Rate
- 5.5 Market Attractiveness
- 5.6 Global Investment & Trade Risks
- 5.7 Pricing Analysis, 2018-2034
- 5.8 Operating Margin/Profits, 2018-2034
- 5.1 Market Size, Value (USD Mn) & Volume (Units)
6. Global Label Applicators Market, By Application
- 6.1 Market Size, Value (USD Mn) & Volume (Units)
- Food & Beverage
- Pharmaceuticals
- Consumer Goods
- 6.2 Key Market Trends & Growth Opportunities
- 6.3 Market Share (%) Analysis, 2018-2034
- 6.4 Year-on-Year (YoY) Growth Rate
- 6.5 Market Attractiveness
- 6.6 Global Investment & Trade Risks
- 6.7 Pricing Analysis, 2018-2034
- 6.8 Operating Margin/Profits, 2018-2034
- 6.1 Market Size, Value (USD Mn) & Volume (Units)
7. Global Label Applicators Market, By Region
- 7.1 Market Size, Value (USD Mn) & Volume (Units)
- North America
- Europe
- Asia Pacific
- Latin America
- Middle East & Africa
- 7.2 Key Market Trends & Growth Opportunities
- 7.3 Market Share (%) Analysis, 2018-2034
- 7.4 Year-on-Year (YoY) Growth Rate
- 7.5 Market Attractiveness
- 7.6 Global Investment & Trade Risks
- 7.7 Pricing Analysis, 2018-2034
- 7.8 Operating Margin/Profits, 2018-2034
- 7.1 Market Size, Value (USD Mn) & Volume (Units)
8. Global Label Applicators Market, By North America
- 8.1 Market Size, Value (USD Mn) & Volume (Units)
- US
- Canada
- 8.2 Key Market Trends & Growth Opportunities
- 8.3 Market Share (%) Analysis, 2018-2034
- 8.4 Year-on-Year (YoY) Growth Rate
- 8.5 Market Attractiveness
- 8.6 Global Investment & Trade Risks
- 8.7 Pricing Analysis, 2018-2034
- 8.8 Operating Margin/Profits, 2018-2034
- 8.1 Market Size, Value (USD Mn) & Volume (Units)
9. Global Label Applicators Market, By Europe
- 9.1 Market Size, Value (USD Mn) & Volume (Units)
- Germany
- France
- UK
- Spain
- Italy
- Switzerland
- Russia
- Poland
- Rest of Europe
- 9.2 Key Market Trends & Growth Opportunities
- 9.3 Market Share (%) Analysis, 2018-2034
- 9.4 Year-on-Year (YoY) Growth Rate
- 9.5 Market Attractiveness
- 9.6 Global Investment & Trade Risks
- 9.7 Pricing Analysis, 2018-2034
- 9.8 Operating Margin/Profits, 2018-2034
- 9.1 Market Size, Value (USD Mn) & Volume (Units)
10. Global Label Applicators Market, By Asia Pacific
- 10.1 Market Size, Value (USD Mn) & Volume (Units)
- China
- Japan
- South Korea
- India
- Australia
- South East Asia
- Rest of APAC
- 10.2 Key Market Trends & Growth Opportunities
- 10.3 Market Share (%) Analysis, 2018-2034
- 10.4 Year-on-Year (YoY) Growth Rate
- 10.5 Market Attractiveness
- 10.6 Global Investment & Trade Risks
- 10.7 Pricing Analysis, 2018-2034
- 10.8 Operating Margin/Profits, 2018-2034
- 10.1 Market Size, Value (USD Mn) & Volume (Units)
11. Global Label Applicators Market, By Latin America
- 11.1 Market Size, Value (USD Mn) & Volume (Units)
- Brazil
- Mexico
- Argentina
- Rest of LATAM
- 11.2 Key Market Trends & Growth Opportunities
- 11.3 Market Share (%) Analysis, 2018-2034
- 11.4 Year-on-Year (YoY) Growth Rate
- 11.5 Market Attractiveness
- 11.6 Global Investment & Trade Risks
- 11.7 Pricing Analysis, 2018-2034
- 11.8 Operating Margin/Profits, 2018-2034
- 11.1 Market Size, Value (USD Mn) & Volume (Units)
12. Global Label Applicators Market, By Middle East & Africa
- 12.1 Market Size, Value (USD Mn) & Volume (Units)
- Saudi Arabia
- UAE
- South Africa
- Rest of MEA
- 12.2 Key Market Trends & Growth Opportunities
- 12.3 Market Share (%) Analysis, 2018-2034
- 12.4 Year-on-Year (YoY) Growth Rate
- 12.5 Market Attractiveness
- 12.6 Global Investment & Trade Risks
- 12.7 Pricing Analysis, 2018-2034
- 12.8 Operating Margin/Profits, 2018-2034
- 12.1 Market Size, Value (USD Mn) & Volume (Units)
13. Competitive Analysis
- 13.1 Competition Landscape, Key Players
- Global Market Share (%) Analysis of Key Players in Label Applicators, in Value (USD Mn) & Volume (Units)
- Company Overview
- Company Financials
- News & Developments
- Strategic Initiatives
- 13.2 Company Profiles
- 13.1 Competition Landscape, Key Players
METHODOLOGY
To provide you with a comprehensive understanding of how we quantify your market opportunity, we utilize a multi-phased methodology designed to minimize risk and maximize strategic clarity. We begin the process by establishing a clear conceptual framework, often referred to as the TAM-SAM-SOM model. By starting with the Total Addressable Market, we look at the absolute global demand for your category. We then refine this into the Serviceable Addressable Market to account for your specific geographic and technological reach, and finally, we pinpoint the Serviceable Obtainable Market. This ensures that the final figures we present are not just theoretical "vanity metrics," but represent a realistic, capture-able revenue target for your business.
Our data collection process relies on a rigorous principle called triangulation, where we cross-reference multiple independent data streams to ensure accuracy. We initiate this with deep-dive secondary research, synthesizing high-value intelligence from audited financial filings, government trade databases, and specialized industry journals. This "desk research" phase provides a macro-economic baseline and identifies historical growth trajectories. However, because secondary data can sometimes lag behind real-time shifts, we supplement this with targeted primary research. This involves direct engagement with Key Opinion Leaders (KOLs) and structured quantitative surveys to capture the current pulse of the market and emerging buyer intent.
To ensure the integrity of our estimates, we employ a dual-modeling approach, calculating the market size from both the "Top-Down" and "Bottom-Up." The Top-Down analysis provides a valuable sanity check against broader economic trends, but we place the most weight on our Bottom-Up modeling. By taking granular data, such as the average transaction value and the actual number of potential customer touchpoints, and scaling them upward, we build a highly defensible model grounded in operational reality. This dual-verification method allows us to identify any discrepancies early, ensuring that the resulting data is robust enough to withstand the scrutiny of stakeholders or investors.
Finally, we recognize that a static market size figure is only a snapshot in time. To provide you with a roadmap for the future, we integrate trend analysis and Compound Annual Growth Rate (CAGR) forecasting into our final reporting. We analyze the underlying drivers, such as regulatory shifts, technological disruptions, or changing consumer behaviors, to predict how the market will evolve over the next three to five years. This ongoing tracking mechanism transforms a simple number into a dynamic strategic tool, allowing you to monitor your market share in real-time and pivot your resources as new opportunities emerge.