Thermal Runaway Mitigation
Thermal Runaway Mitigation Market Research Report 2036
Thermal Runaway Mitigation Market Segments - by Component (Battery Management Systems, Thermal Management Systems, Fire Suppression Systems, Sensors and Monitoring Devices, Software Solutions), Application (Electric Vehicles, Consumer Electronics, Energy Storage Systems, Aerospace and Defense, Industrial Equipment), Technology (Active Mitigation, Passive Mitigation, Hybrid Mitigation, Advanced Cooling Technologies, Fire Retardant Materials), End User (Automotive Manufacturers, Battery Manufacturers, Electronics Manufacturers, Energy Providers, Aerospace Companies), and Region (North America, Europe, Asia Pacific, Latin America, Middle East & Africa) - The Market Forecasts are Provided in Terms of Value (USD)
Thermal Runaway Mitigation Market Outlook
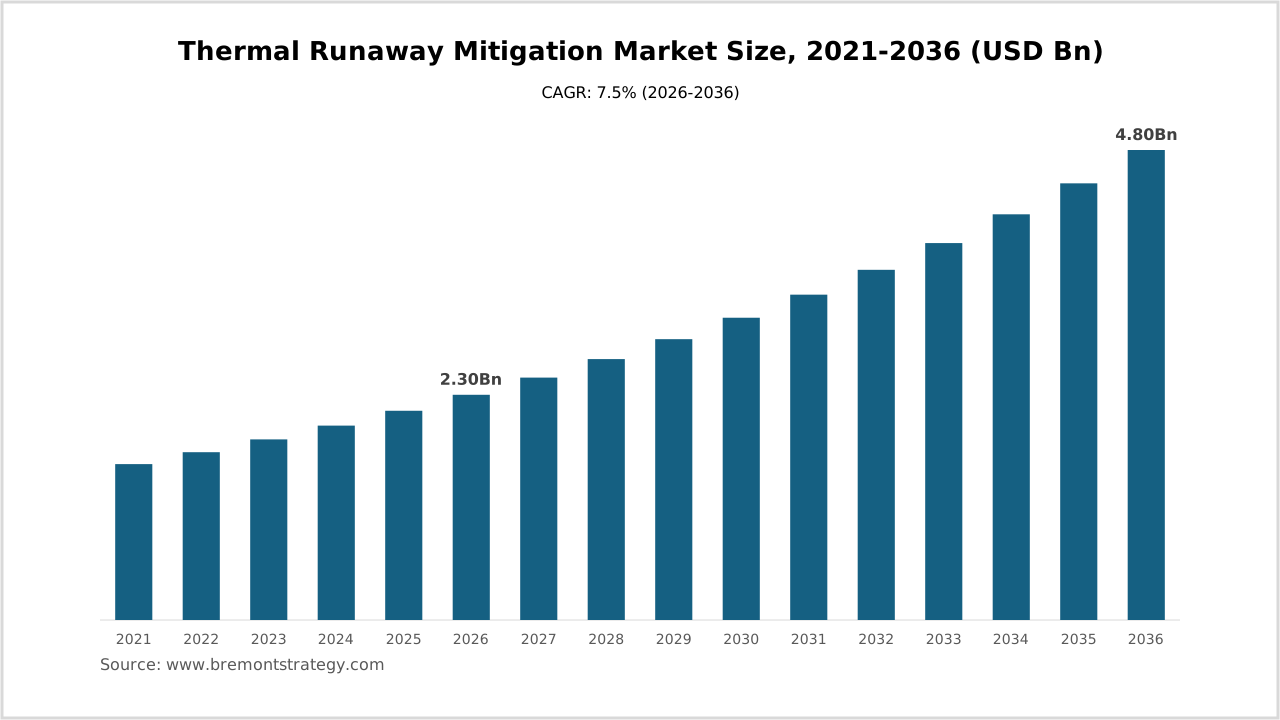
The Thermal Runaway Mitigation market was valued at $2.3 Billion in 2026 and is projected to reach $4.8 Billion by 2036, growing at a CAGR of 7.5% during the forecast period 2026-2036. This growth is driven by increasing demand for safety in energy storage systems and electric vehicles.
Thermal runaway mitigation involves technologies and systems designed to prevent or manage the rapid increase in temperature within batteries, which can lead to catastrophic failures. It is distinct from conventional approaches due to its focus on both prevention and active management of thermal events, utilizing advanced sensors, software, and materials.
Overall demand is driven by the growing adoption of electric vehicles and renewable energy storage solutions, which necessitate robust safety mechanisms to prevent thermal incidents. Regulatory mandates for battery safety further bolster market growth.
Technology development trends indicate a shift towards hybrid mitigation systems that combine active and passive methods, with significant R&D investments in advanced cooling technologies and fire retardant materials.
Competitive dynamics in the market are shaped by factors such as technical performance, cost-effectiveness, and the ability to integrate with existing battery systems. Vendors compete on the basis of innovation, reliability, and comprehensive support services, which are critical for adoption.
Thermal Runaway Mitigation Market Key Takeaways
- The Thermal Runaway Mitigation market is expected to grow from $2.3 Billion in 2026 to $4.8 Billion by 2036, at a CAGR of 7.5%.
- The "By Component" segment is led by Battery Management Systems, which are projected to grow at a significant rate due to their critical role in safety.
- Asia Pacific is the leading region, accounting for over 35% of the market share, driven by the expansion of electric vehicle production.
- Increasing regulatory standards for battery safety are a major driver of demand across all segments.
Thermal Runaway Mitigation Market Key Drivers
| Drivers | Impact |
|---|---|
| Electric Vehicle Adoption | Increasing EV sales drive demand for advanced safety systems. |
| Energy Storage Expansion | Rising renewable energy use requires reliable storage solutions. |
| Regulatory Standards | Stricter safety regulations enhance market growth. |
| Technological Advancements | Innovations in materials and systems boost market potential. |
| Consumer Safety Awareness | Growing awareness of battery safety risks increases adoption. |
Electric Vehicle Adoption
The surge in electric vehicle (EV) adoption is a primary driver for the thermal runaway mitigation market. As EVs become more prevalent, the need for reliable and safe battery systems intensifies, pushing manufacturers to integrate advanced thermal management solutions to prevent overheating and ensure passenger safety.
Energy Storage Expansion
With the expansion of renewable energy sources, the demand for efficient energy storage systems has increased. These systems require robust thermal management to prevent failures, thereby driving the market for thermal runaway mitigation technologies.
Regulatory Standards
Regulatory bodies worldwide are implementing stricter safety standards for batteries, especially in automotive and energy sectors. Compliance with these regulations necessitates the adoption of advanced thermal runaway mitigation solutions, thus propelling market growth.
Technological Advancements
Continuous technological advancements in materials and system designs are enhancing the effectiveness of thermal runaway mitigation solutions. Innovations such as advanced cooling technologies and fire retardant materials are expanding the market's potential.
Consumer Safety Awareness
Increasing consumer awareness about the risks associated with battery failures is influencing purchasing decisions towards safer, more reliable products. This trend is encouraging manufacturers to prioritize thermal management solutions in their offerings.
Thermal Runaway Mitigation Market Opportunities and Challenges
| Opportunity | Challenges |
|---|---|
| EV Market Growth | High R&D Costs |
| Renewable Energy Integration | Complexity of Systems |
| Advanced Material Development | Regulatory Compliance |
The thermal runaway mitigation market presents significant opportunities, particularly with the growth of the electric vehicle market, which demands advanced safety systems. Additionally, the integration of renewable energy sources into power grids is driving the need for reliable energy storage solutions, creating further opportunities for thermal management technologies. The development of advanced materials also offers potential for innovation and market expansion.
However, the market faces challenges such as high R&D costs associated with developing new technologies and the complexity of integrating these systems into existing infrastructures. Regulatory compliance remains a significant hurdle, as manufacturers must meet stringent safety standards, which can be costly and time-consuming.
Thermal Runaway Mitigation Market Report Scope
| Attributes | Details |
|---|---|
| Report Title | Thermal Runaway Mitigation Market Research Report 2036 |
| By Component | Battery Management Systems, Thermal Management Systems, Fire Suppression Systems, Sensors and Monitoring Devices, Software Solutions |
| By Application | Electric Vehicles, Consumer Electronics, Energy Storage Systems, Aerospace and Defense, Industrial Equipment |
| By Technology | Active Mitigation, Passive Mitigation, Hybrid Mitigation, Advanced Cooling Technologies, Fire Retardant Materials |
| By End User | Automotive Manufacturers, Battery Manufacturers, Electronics Manufacturers, Energy Providers, Aerospace Companies |
| By Region | North America, Europe, Asia Pacific, Latin America, Middle East & Africa |
| Countries Covered | North America (United States, Canada), Europe (Germany, France, UK, Italy, Spain, Rest of Europe), Asia Pacific (China, Japan, India, South Korea, Australia, Rest of Asia Pacific), Latin America (Brazil, Mexico, Rest of Latin America), Middle East & Africa (Saudi Arabia, UAE, South Africa, Rest of Middle East & Africa) |
| Base Year | 2026 |
| Historic Data | 2021-2025 |
| Forecast Period | 2026-2036 |
| Number of Pages | 280 |
| Number of Tables & Figures | 350 |
| Customization Available | Yes, the report can be customized as per your need. |
Thermal Runaway Mitigation Market Segment Analysis
The Thermal Runaway Mitigation market is segmented into various categories, including components, applications, technologies, end users, and regions. Each segment plays a crucial role in shaping the market dynamics and growth trajectory.
By Component Analysis
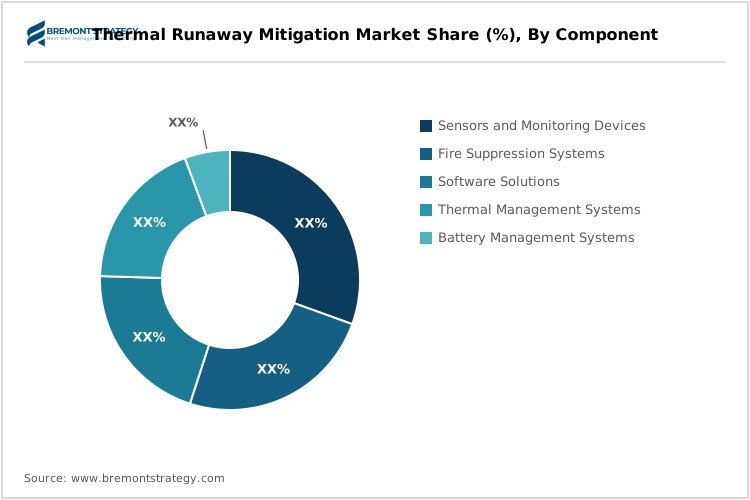
The component segment of the thermal runaway mitigation market is dominated by Battery Management Systems, which are essential for monitoring and controlling battery conditions to prevent thermal events. These systems are integral to ensuring the safety and longevity of battery-powered devices, making them a critical component in the market.
Thermal Management Systems also play a significant role, as they are designed to maintain optimal temperature conditions within batteries, thereby preventing overheating and potential failures. The demand for these systems is driven by the increasing complexity and power density of modern batteries.
Fire Suppression Systems, Sensors and Monitoring Devices, and Software Solutions are also vital components, each contributing to the overall safety and efficiency of thermal management solutions. The integration of advanced sensors and software allows for real-time monitoring and predictive analytics, enhancing the effectiveness of thermal management strategies.
By Application Analysis
Electric Vehicles represent the largest application segment for thermal runaway mitigation technologies, driven by the rapid growth of the EV market and the critical need for battery safety. As EV adoption increases, so does the demand for effective thermal management solutions to ensure passenger safety and battery longevity.
Consumer Electronics is another significant application area, as the proliferation of portable devices with high energy densities necessitates robust thermal management to prevent overheating and potential hazards.
Energy Storage Systems, Aerospace and Defense, and Industrial Equipment also benefit from thermal runaway mitigation technologies, as these applications require reliable and safe energy storage solutions to operate effectively in various environments.
By Technology Analysis
The technology segment is characterized by a diverse range of solutions, including Active Mitigation, Passive Mitigation, and Hybrid Mitigation technologies. Active Mitigation involves real-time monitoring and intervention to prevent thermal events, while Passive Mitigation focuses on materials and designs that inherently resist overheating.
Hybrid Mitigation combines the strengths of both active and passive approaches, offering a comprehensive solution that maximizes safety and efficiency. This technology is gaining traction as manufacturers seek to enhance the reliability of their thermal management systems.
Advanced Cooling Technologies and Fire Retardant Materials are also critical components of the technology segment, providing innovative solutions to manage and mitigate thermal runaway risks effectively.
By End User Analysis
Automotive Manufacturers are the primary end users of thermal runaway mitigation technologies, driven by the need to ensure the safety and reliability of electric vehicles. These manufacturers invest heavily in advanced thermal management solutions to meet regulatory standards and consumer expectations.
Battery Manufacturers also play a crucial role, as they develop and supply the core components that require effective thermal management. Their focus on innovation and safety drives demand for advanced mitigation technologies.
Electronics Manufacturers, Energy Providers, and Aerospace Companies are other key end users, each requiring tailored solutions to address their specific thermal management challenges and ensure operational safety.
By Region Analysis
North America leads the thermal runaway mitigation market, driven by the strong presence of automotive and electronics manufacturers, as well as stringent regulatory standards for battery safety. The region's focus on innovation and technological advancement further supports market growth.
Europe is another significant market, with a strong emphasis on sustainability and renewable energy integration. The region's commitment to reducing carbon emissions and enhancing energy efficiency drives demand for advanced thermal management solutions.
Asia Pacific is the fastest-growing region, fueled by the rapid expansion of the electric vehicle market and the increasing adoption of renewable energy sources. The region's large manufacturing base and supportive government policies further contribute to market growth.
Latin America presents emerging opportunities, particularly in the energy sector, where the integration of renewable energy sources is driving demand for reliable energy storage solutions. The region's focus on infrastructure development also supports market expansion.
The Middle East & Africa region is characterized by growing investments in renewable energy projects and infrastructure development, which create opportunities for thermal runaway mitigation technologies. The region's harsh environmental conditions further necessitate robust thermal management solutions.
Thermal Runaway Mitigation Market Regional Outlook
| Regional Outlook | |
|---|---|
| Largest Market | Asia Pacific |
| Fastest Growing Market | Asia Pacific |
| Emerging Countries | India, Brazil, Saudi Arabia |
| Future Outlook | Continued growth driven by EV adoption and renewable energy integration. |
North America remains a leader in the thermal runaway mitigation market, driven by a strong focus on innovation and stringent regulatory standards. The presence of major automotive and electronics manufacturers further supports market growth in this region.
Europe's market is characterized by its commitment to sustainability and energy efficiency, with increasing investments in renewable energy projects. The region's regulatory environment also encourages the adoption of advanced thermal management solutions.
Asia-Pacific is the fastest-growing market, with significant investments in electric vehicle production and renewable energy integration. The region's large manufacturing base and supportive government policies contribute to its rapid market expansion.
Latin America is emerging as a key market, particularly in the energy sector, where the integration of renewable energy sources is driving demand for reliable energy storage solutions. The region's focus on infrastructure development further supports market growth.
The Middle East & Africa region is characterized by growing investments in renewable energy projects and infrastructure development, creating opportunities for thermal runaway mitigation technologies. The region's harsh environmental conditions further necessitate robust thermal management solutions.
Thermal Runaway Mitigation Market Competitor Outlook
| Competitor Outlook | |
|---|---|
| Market Leader |
|
| Key Players |
|
| Key Competitive Factors |
|
Thermal Runaway Mitigation Pricing Analysis
Pricing in the thermal runaway mitigation market is influenced by several factors, including the formulation and specification of the technologies used, the scale of production, and regional market dynamics. Advanced systems with integrated sensors and software solutions tend to command higher prices due to their enhanced capabilities and reliability. Additionally, economies of scale play a significant role, with larger manufacturers able to offer competitive pricing.
Price sensitivity in this market varies depending on the end user and application. While some buyers prioritize cost-effectiveness, others are more focused on the value and performance of the solutions, particularly in high-stakes applications such as electric vehicles and aerospace. As a result, manufacturers must balance pricing with the perceived value and benefits of their products to meet diverse customer needs.
Thermal Runaway Mitigation Consumer Buying Behaviour / Preference Analysis
Key Purchase Criteria
| Buying Factor | Relative Importance | Reason |
|---|---|---|
| Performance | Very High | Ensures safety and reliability |
| Durability/Reliability | High | Long-term operational efficiency |
| Certification/Compliance | Medium-High | Meets regulatory standards |
| Total Cost | Medium | Budget constraints |
| Differentiating Capability | High | Competitive advantage |
Typical buyers in the thermal runaway mitigation market include procurement managers, safety officers, and engineers within automotive, electronics, and energy companies. These individuals are responsible for ensuring that the products they select meet stringent safety and performance criteria, as well as compliance with regulatory standards.
The most influential factors in their purchasing decisions include the performance and reliability of the solutions, as these directly impact the safety and efficiency of their operations. Additionally, certification and compliance with industry standards are critical, as they ensure that the products meet necessary safety regulations. Price is also a consideration, but it is often weighed against the overall value and benefits provided by the solution.
TABLE OF CONTENTS
1. Research Methodology
2. Market Structure
3. Executive Summary
4. Thermal Runaway Mitigation Market Overview
- 4.1 Introduction
- Market Snapshot
- Assumptions, Inclusion & Exclusions
- Technological Advancements & Patent Analysis
- Case Studies
- Market Entry & Launch Strategies
- Macro-Economic Factors Impacting the Market Growth
- 4.2 Thermal Runaway Mitigation Market Dynamics
- Market Drivers
- Market Restraints
- Market Opportunity
- 4.3 Thermal Runaway Mitigation Market - Supply Chain Analysis
- Key Raw Material/Components Provider
- Key Manufacturers
- Key Distributors
- Key Consumers
- 4.4 Key Forces Shaping the Thermal Runaway Mitigation Market
- Bargaining Power of Suppliers
- Bargaining Power of Buyers
- Threat of Substitution
- Threat of New Entrants
- Competitive Rivalry
- 4.1 Introduction
5. Global Thermal Runaway Mitigation Market, By Component
- 5.1 Market Size, Value (USD Mn) & Volume (Units)
- Battery Management Systems
- Thermal Management Systems
- Fire Suppression Systems
- Sensors and Monitoring Devices
- Software Solutions
- 5.2 Key Market Trends & Growth Opportunities
- 5.3 Market Share (%) Analysis, 2021-2036
- 5.4 Year-on-Year (YoY) Growth Rate
- 5.5 Market Attractiveness
- 5.6 Global Investment & Trade Risks
- 5.7 Pricing Analysis, 2021-2036
- 5.8 Operating Margin/Profits, 2021-2036
- 5.1 Market Size, Value (USD Mn) & Volume (Units)
6. Global Thermal Runaway Mitigation Market, By Application
- 6.1 Market Size, Value (USD Mn) & Volume (Units)
- Electric Vehicles
- Consumer Electronics
- Energy Storage Systems
- Aerospace and Defense
- Industrial Equipment
- 6.2 Key Market Trends & Growth Opportunities
- 6.3 Market Share (%) Analysis, 2021-2036
- 6.4 Year-on-Year (YoY) Growth Rate
- 6.5 Market Attractiveness
- 6.6 Global Investment & Trade Risks
- 6.7 Pricing Analysis, 2021-2036
- 6.8 Operating Margin/Profits, 2021-2036
- 6.1 Market Size, Value (USD Mn) & Volume (Units)
7. Global Thermal Runaway Mitigation Market, By Technology
- 7.1 Market Size, Value (USD Mn) & Volume (Units)
- Active Mitigation
- Passive Mitigation
- Hybrid Mitigation
- Advanced Cooling Technologies
- Fire Retardant Materials
- 7.2 Key Market Trends & Growth Opportunities
- 7.3 Market Share (%) Analysis, 2021-2036
- 7.4 Year-on-Year (YoY) Growth Rate
- 7.5 Market Attractiveness
- 7.6 Global Investment & Trade Risks
- 7.7 Pricing Analysis, 2021-2036
- 7.8 Operating Margin/Profits, 2021-2036
- 7.1 Market Size, Value (USD Mn) & Volume (Units)
8. Global Thermal Runaway Mitigation Market, By End User
- 8.1 Market Size, Value (USD Mn) & Volume (Units)
- Automotive Manufacturers
- Battery Manufacturers
- Electronics Manufacturers
- Energy Providers
- Aerospace Companies
- 8.2 Key Market Trends & Growth Opportunities
- 8.3 Market Share (%) Analysis, 2021-2036
- 8.4 Year-on-Year (YoY) Growth Rate
- 8.5 Market Attractiveness
- 8.6 Global Investment & Trade Risks
- 8.7 Pricing Analysis, 2021-2036
- 8.8 Operating Margin/Profits, 2021-2036
- 8.1 Market Size, Value (USD Mn) & Volume (Units)
9. Global Thermal Runaway Mitigation Market, By Region
- 9.1 Market Size, Value (USD Mn) & Volume (Units)
- North America
- Europe
- Asia Pacific
- Latin America
- Middle East & Africa
- 9.2 Key Market Trends & Growth Opportunities
- 9.3 Market Share (%) Analysis, 2021-2036
- 9.4 Year-on-Year (YoY) Growth Rate
- 9.5 Market Attractiveness
- 9.6 Global Investment & Trade Risks
- 9.7 Pricing Analysis, 2021-2036
- 9.8 Operating Margin/Profits, 2021-2036
- 9.1 Market Size, Value (USD Mn) & Volume (Units)
10. Global Thermal Runaway Mitigation Market, By North America
- 10.1 Market Size, Value (USD Mn) & Volume (Units)
- US
- Canada
- 10.2 Key Market Trends & Growth Opportunities
- 10.3 Market Share (%) Analysis, 2021-2036
- 10.4 Year-on-Year (YoY) Growth Rate
- 10.5 Market Attractiveness
- 10.6 Global Investment & Trade Risks
- 10.7 Pricing Analysis, 2021-2036
- 10.8 Operating Margin/Profits, 2021-2036
- 10.1 Market Size, Value (USD Mn) & Volume (Units)
11. Global Thermal Runaway Mitigation Market, By Europe
- 11.1 Market Size, Value (USD Mn) & Volume (Units)
- Germany
- France
- UK
- Spain
- Italy
- Switzerland
- Russia
- Poland
- Rest of Europe
- 11.2 Key Market Trends & Growth Opportunities
- 11.3 Market Share (%) Analysis, 2021-2036
- 11.4 Year-on-Year (YoY) Growth Rate
- 11.5 Market Attractiveness
- 11.6 Global Investment & Trade Risks
- 11.7 Pricing Analysis, 2021-2036
- 11.8 Operating Margin/Profits, 2021-2036
- 11.1 Market Size, Value (USD Mn) & Volume (Units)
12. Global Thermal Runaway Mitigation Market, By Asia Pacific
- 12.1 Market Size, Value (USD Mn) & Volume (Units)
- China
- Japan
- South Korea
- India
- Australia
- South East Asia
- Rest of APAC
- 12.2 Key Market Trends & Growth Opportunities
- 12.3 Market Share (%) Analysis, 2021-2036
- 12.4 Year-on-Year (YoY) Growth Rate
- 12.5 Market Attractiveness
- 12.6 Global Investment & Trade Risks
- 12.7 Pricing Analysis, 2021-2036
- 12.8 Operating Margin/Profits, 2021-2036
- 12.1 Market Size, Value (USD Mn) & Volume (Units)
13. Global Thermal Runaway Mitigation Market, By Latin America
- 13.1 Market Size, Value (USD Mn) & Volume (Units)
- Brazil
- Mexico
- Argentina
- Rest of LATAM
- 13.2 Key Market Trends & Growth Opportunities
- 13.3 Market Share (%) Analysis, 2021-2036
- 13.4 Year-on-Year (YoY) Growth Rate
- 13.5 Market Attractiveness
- 13.6 Global Investment & Trade Risks
- 13.7 Pricing Analysis, 2021-2036
- 13.8 Operating Margin/Profits, 2021-2036
- 13.1 Market Size, Value (USD Mn) & Volume (Units)
14. Global Thermal Runaway Mitigation Market, By Middle East & Africa
- 14.1 Market Size, Value (USD Mn) & Volume (Units)
- Saudi Arabia
- UAE
- South Africa
- Rest of MEA
- 14.2 Key Market Trends & Growth Opportunities
- 14.3 Market Share (%) Analysis, 2021-2036
- 14.4 Year-on-Year (YoY) Growth Rate
- 14.5 Market Attractiveness
- 14.6 Global Investment & Trade Risks
- 14.7 Pricing Analysis, 2021-2036
- 14.8 Operating Margin/Profits, 2021-2036
- 14.1 Market Size, Value (USD Mn) & Volume (Units)
15. Competitive Analysis
- 15.1 Competition Landscape, Key Players
- Global Market Share (%) Analysis of Key Players in Thermal Runaway Mitigation, in Value (USD Mn) & Volume (Units)
- Company Overview
- Company Financials
- News & Developments
- Strategic Initiatives
- 15.2 Company Profiles
- 3M Company
- BASF SE
- DuPont de Nemours, Inc.
- Honeywell International Inc.
- Johnson Controls International plc
- LG Chem Ltd.
- Panasonic Corporation
- Samsung SDI Co., Ltd.
- Tesla, Inc.
- BYD Company Limited
- Contemporary Amperex Technology Co., Limited (CATL)
- Saft Groupe S.A.
- Hitachi Chemical Co., Ltd.
- Enersys
- Exide Technologies
- GS Yuasa Corporation
- Toshiba Corporation
- VARTA AG
- Leclanché SA
- A123 Systems LLC
- 15.1 Competition Landscape, Key Players
METHODOLOGY
To provide you with a comprehensive understanding of how we quantify your market opportunity, we utilize a multi-phased methodology designed to minimize risk and maximize strategic clarity. We begin the process by establishing a clear conceptual framework, often referred to as the TAM-SAM-SOM model. By starting with the Total Addressable Market, we look at the absolute global demand for your category. We then refine this into the Serviceable Addressable Market to account for your specific geographic and technological reach, and finally, we pinpoint the Serviceable Obtainable Market. This ensures that the final figures we present are not just theoretical "vanity metrics," but represent a realistic, capture-able revenue target for your business.
Our data collection process relies on a rigorous principle called triangulation, where we cross-reference multiple independent data streams to ensure accuracy. We initiate this with deep-dive secondary research, synthesizing high-value intelligence from audited financial filings, government trade databases, and specialized industry journals. This "desk research" phase provides a macro-economic baseline and identifies historical growth trajectories. However, because secondary data can sometimes lag behind real-time shifts, we supplement this with targeted primary research. This involves direct engagement with Key Opinion Leaders (KOLs) and structured quantitative surveys to capture the current pulse of the market and emerging buyer intent.
To ensure the integrity of our estimates, we employ a dual-modeling approach, calculating the market size from both the "Top-Down" and "Bottom-Up." The Top-Down analysis provides a valuable sanity check against broader economic trends, but we place the most weight on our Bottom-Up modeling. By taking granular data, such as the average transaction value and the actual number of potential customer touchpoints, and scaling them upward, we build a highly defensible model grounded in operational reality. This dual-verification method allows us to identify any discrepancies early, ensuring that the resulting data is robust enough to withstand the scrutiny of stakeholders or investors.
Finally, we recognize that a static market size figure is only a snapshot in time. To provide you with a roadmap for the future, we integrate trend analysis and Compound Annual Growth Rate (CAGR) forecasting into our final reporting. We analyze the underlying drivers, such as regulatory shifts, technological disruptions, or changing consumer behaviors, to predict how the market will evolve over the next three to five years. This ongoing tracking mechanism transforms a simple number into a dynamic strategic tool, allowing you to monitor your market share in real-time and pivot your resources as new opportunities emerge.
Frequently Asked Questions
What is the current size of the Thermal Runaway Mitigation market?
The base year for the Thermal Runaway Mitigation market is 2026, with a market size of $2.3 billion.
What is the projected market size by 2036?
The Thermal Runaway Mitigation market is projected to reach a size of $4.8 billion by the year 2036.
What is the market's CAGR during the forecast period?
The market is expected to grow at a compound annual growth rate (CAGR) of 7.5% from 2026 to 2036.
Which region is leading or fastest-growing in this market?
Currently, North America leads the market, while Asia-Pacific is anticipated to be the fastest-growing region during the forecast period.
Which segment holds the largest share in the market?
The battery segment holds the largest share in the Thermal Runaway Mitigation market, driven by the increasing adoption of electric vehicles.
Who are the key players in this market?
Key players in the Thermal Runaway Mitigation market include companies like Tesla, LG Chem, and Panasonic, among others.
What are the key growth drivers for this market?
The major growth drivers include the rising demand for electric vehicles and stringent safety regulations regarding battery systems.
Is the report customizable?
Yes, the report can be customized as per specific requirements to better meet the needs of stakeholders.